Ethan Liu

Statistics @UChicago

Data Science • Machine Learning • NLP

Python • R • D3.js


Two Python Packages

One Thesis on NLP


Psychology @NTU • Cognition and Human Behavior

Multidisciplinary  Domain Knowledge

Blog

About

I am a MS Statistics student at The University of Chicago. I received my BS degree at National Taiwan University, majored Psychology. Though I am interested in almost every discipline, I am currently working toward Data Science.

Not because it’s the sexiest job but it’s the sexiest path (to me) to learn as many fields as possible.

Background

Background

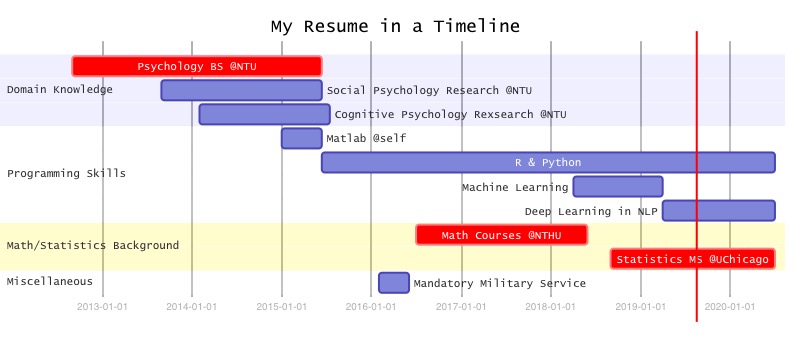
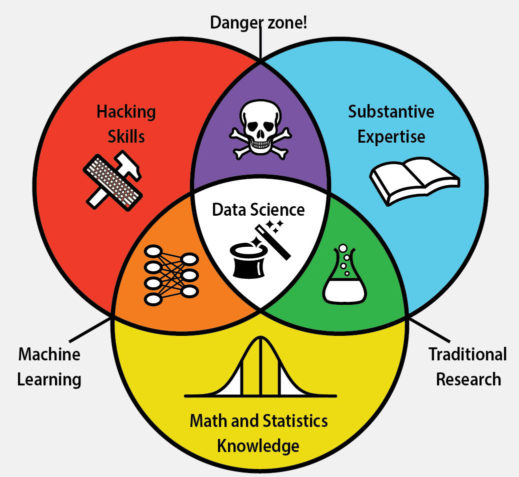
Here I represent my learning map in a timeline, grouped by domain knowledge, programming skills and math/statistics background. I have multiple different projects conducted through these experience.

[Last update: 20190816]

Multidisciplinary Interest

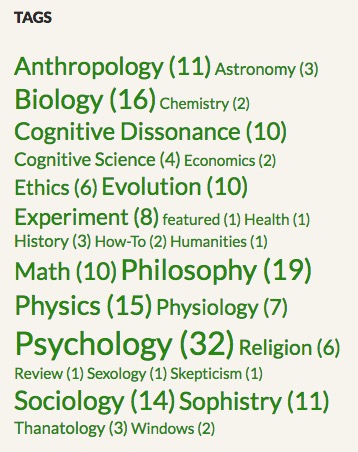
I have multidisciplinary interest. Mainly in hard science (e.g., Physics, Math), social science (Psychology, Economics, Anthropology) and others like Religion Study and Philosophy. The picture on the right displays tags of articles in my blog over past 10 years.
Go to My Blog
Multidisciplinary Interest
Me toward Data Science

Me toward Data Science

Domain knowledge: I have rigorous training in Psychology at National Taiwan University. Though I graduated in 3 years, I have experience in psychology research and familiar with literatures in the fields of Cognitive Psychology, Social Psychology, Media Psychology, and Positive Psychology. Moreover, my multidisplinary interest makes me the best candidate to learn everything needed.

Programming skills: I self-studied programming and algorithms on MOOCs. I have learned 26 courses and thus proficient in R and python, familiar with C++, Matlab, SPSS, and SQL.

Mathematical background: Though I majored Psychology in college. I thereafter took many credit courses in National Tsing Hua University. Including Advanced Calculus, Linear Algebra, Probability, and Mathematical Statistics.
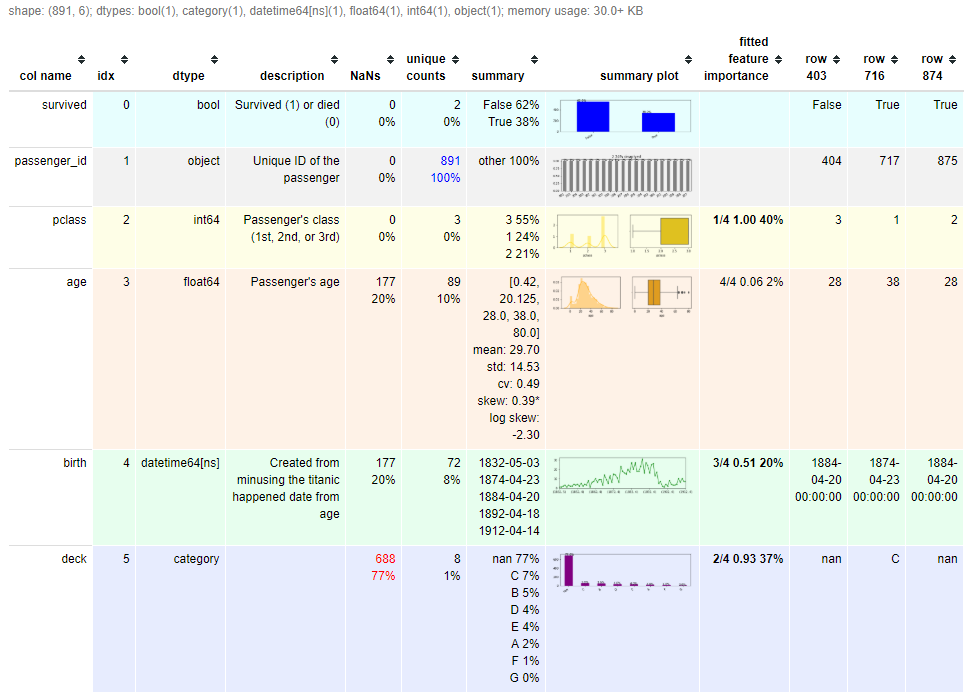
TEF: My Exploratory Data Analysis Package in Python

TEF: My Exploratory Data Analysis Package in Python

In summary, it generates a metadata dataframe (like above) that summarize everything using one line TEF.dfmeta. It also include a few one line function that you can

  • auto_set_dtypes
  • plot_1var: plot univariate plots for every columns
  • fit: fit default machine learning models by doing everything with default setting


With these, you can generate a metadata dataframe in another file as a data dictionary, with variable descriptions, feature importance of your trained model and a quick summary plot. See quick start in my blog for more detail.
Quick StartGitHub
sldt: When S/L Method Becomes a Package

sldt: When S/L Method Becomes a Package

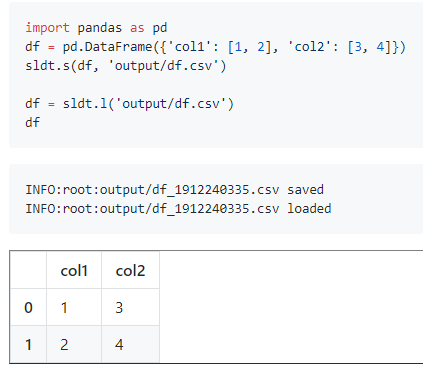
Remember playing the traditional Pokemon on a Gameboy? Save/Load every time at a critical moment, aren’t we?

Now sldt saves your files to the format you need with datetime appended; when you need them, it finds the newest and loads it back without any hassle.

GitHub

Retirement Calculator

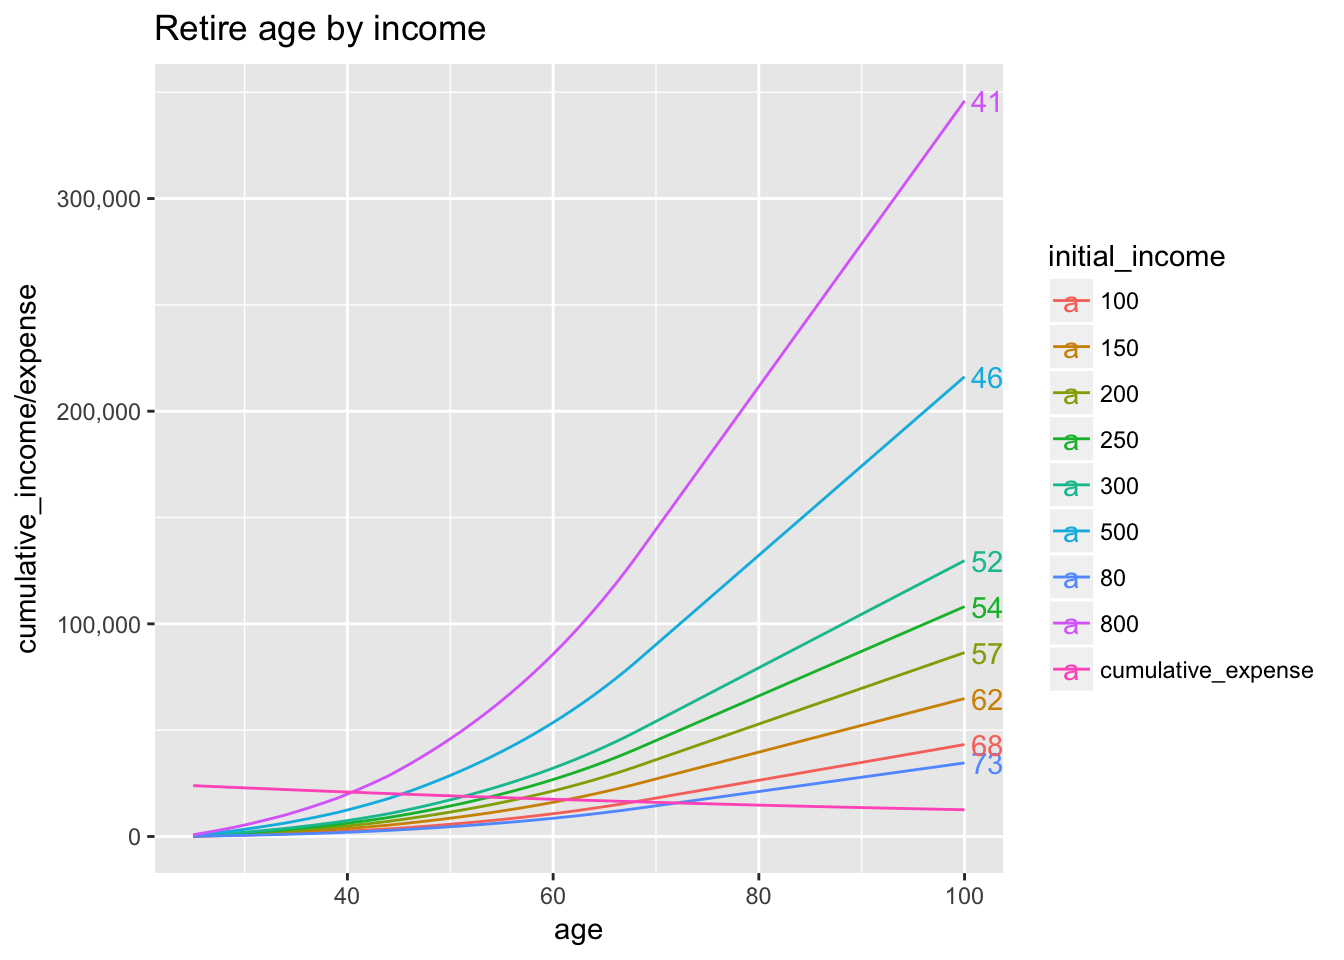
A simulation of when can one retire, given income, income growth, age, expenses, etc.
Retirement Calculator

Data Geek

I’m a data-driven and experiment-oriented guy that I record everything in my daily life, conduct experiments and analyze my own data to make decision.

Example including:
– made an income and expenses simulator to calculate the expected retired age (above)
– use regression to analyze my FB posts to conclude popular factors
– manipulate my life cycle and daily activities to model my sickness, fitness, blood pressure, blood sugar, etc.
– record my daily tasks 24/7 and every activities on PC using several recording app/technique, for time-management
– arrange multiple spreadsheets from comparing gadgets I wish to buy, courses I’d to take to school I’m going to apply; design several scoring system and scoring system for those scoring system (yes, Sheldon copied me)
– and more… only some of them are on my blog

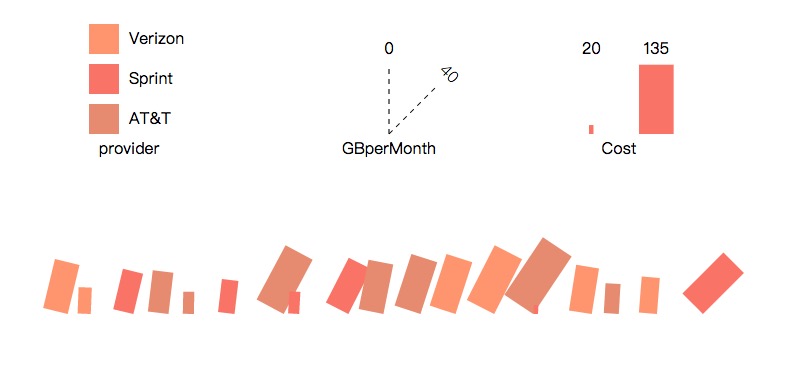
Data visualization (Bad)

Data visualization (Bad)

A bad example! (constructed using D3.js)
Just for fun.

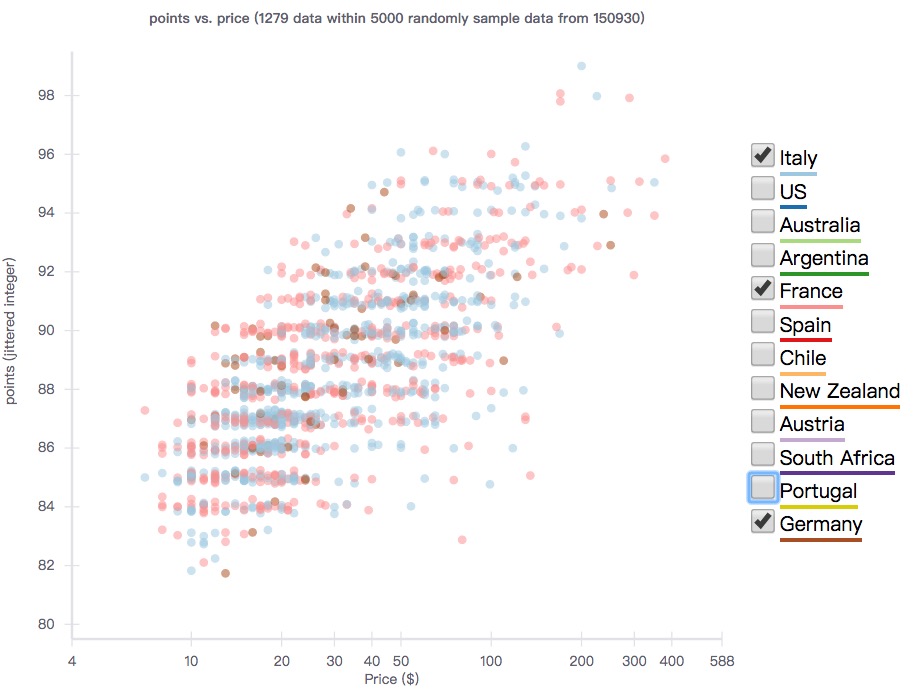
Data visulization (Good)

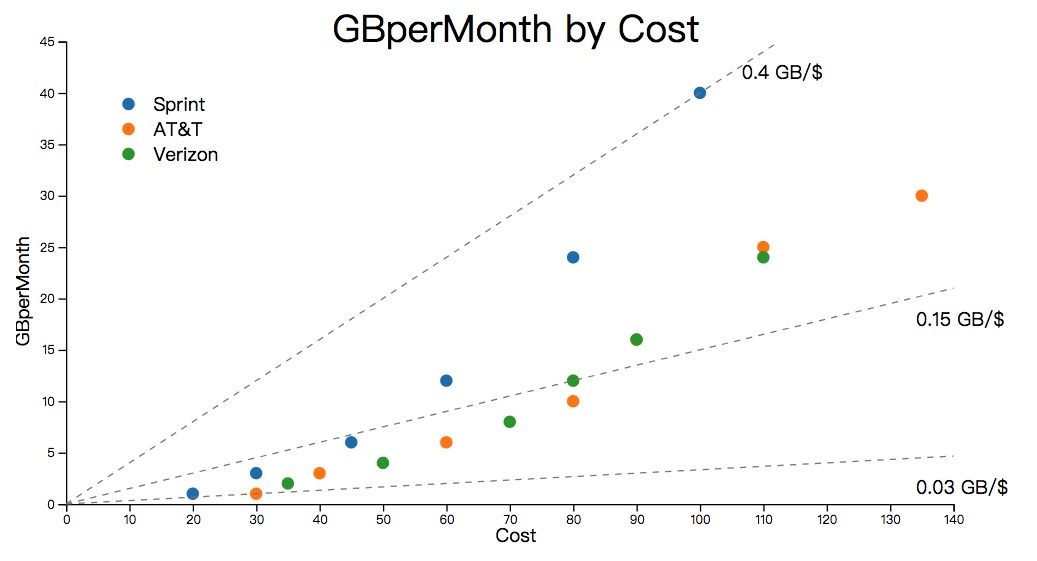
A good example with the same data. (constructed using D3.js)
Data visulization (Good)

Projects

Here I display some of my projects, a full list and a brief introduction can be found in my blog. Though they are not published in academic journals, I am proud of them and most of the contents are original.

Go to my blog

A List of My Projects

These are not something super impressive, but I am proud of them and most of them are original.

Machine learning related

  • 2019. Text Sequence Prediction in Novels
  • 2019. Handwritten Digits Classification
  • 2016. Swear Words in Customers’ Review: Regional Variation and Predictability

Statistics related

  • 2015. Validation of Psychological Questionnaires in Taiwanese Undergraduate Students
  • 2013. Predictors of Facebook likes
  • 2010. Prediction on the Lowest Unique Bid Auction System

Psychology related

Literature Reviews

Others

Experiments


Wine Recommender

Wine Recommender

Web

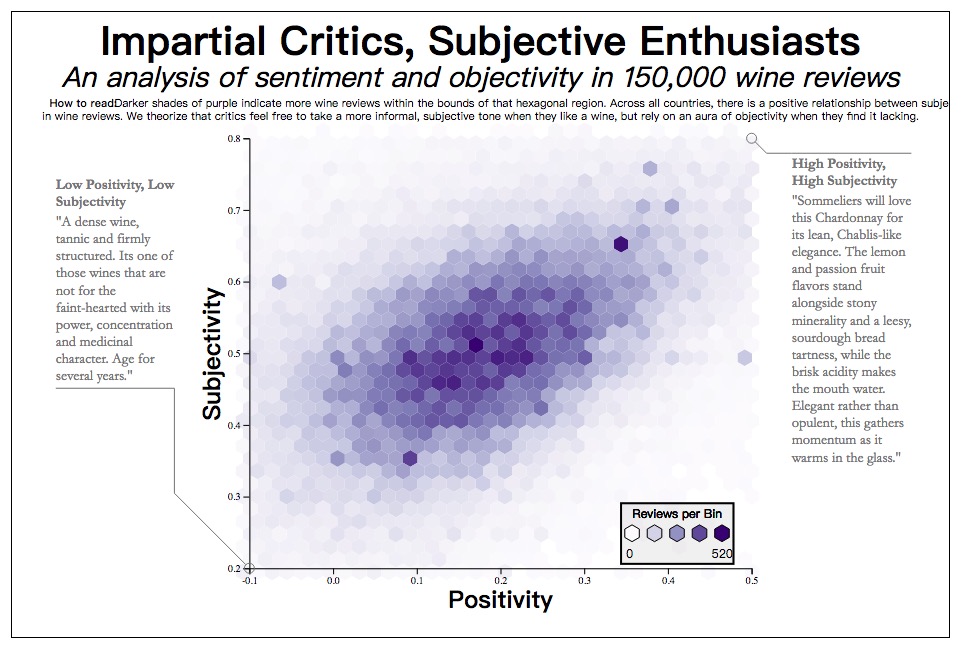
More Visualizations

More Visualizations

Contact Me